One of the features of VStar is that it is set up so that you, the user, can think up new and interesting new ways to use the basic program. You can do this by creating your own plug-in or by using ones that others have created to extend the power of VStar. If you are interested in creating your own, please read the documentation on how to do this. If you would like to see some plug-ins that others have created, you have come to the right place.
This page contains a list of VStar plug-ins which we feel might be of use to you. If you are looking for general information about VStar or would like to find out how to get it, please go to the the VStar overview and download page.
How to Use VStar Plug-ins
To load new or update old plug-ins, simply click "Tool", then "Plug-in Manager..." in VStar's menu bar. You will then see a window containing a scrollable list of all of the available plug-ins. Click on the ones you are interested in and one-by-one, you will have the option to:
- Install it if you do not already have the selected plug-in
- Update the plug-in if there is an update available
- Delete the selected plug-in from your local computer
To install, update, or delete everything, just click the All? box first.
If you install or update a plug-in, you will have to close VStar then re-open it for the plug-in to become available.

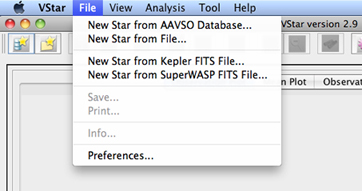
You may adjust some of your settings for the Plug-in Manager (the file path and whether or not you wish for your plug-ins to load automatically) by clicking on the "File" and "Preferences..." menu items, then selecting the "Plug-in Settings" tab.
If you have placed the plug-in correctly, you should be able to see it listed in the appropriate menu next time you run VStar. Just which menu will show the plug-in depends on the plug-in type:
- Custom Filter - filters data in the plots and tables as per the View -> Filter... menu item, permitting an arbitrarily complex filter expression. Custom filters will appear in the View -> Custom Filter sub-menu
- General Tool - is intended to be used for general utilities and will appear in the Tool menu
- Model Creator - will appear in the Analysis menu and can be used to create an arbitrary model of the loaded dataset, e.g. custom curve fitting.
- Observation Sink - will appear in the file save chooser and permits the observation list to be saved in a particular format.
- Observation Source - will appear in the File menu or within a file chooser and permits observation datasets to be loaded from arbitrary sources, such as FITS files, web services or HTTP data streams, databases other than AAVSO’s, or special file formats. Implementations of these plug-ins have been the most frequent of all so far.
- Observation Tool - will appear in the Tool menu and is able to perform arbitrary processing on the currently loaded dataset.
- Observation Transformer - will appear in the Tool menu and can be used to transform currently loaded observations in arbitrary ways
- Period Analysis - will appear in the Analysis -> Period Search sub-menu and applies an algorithm such as a Fourier Transform to a particular series (band) of the loaded dataset. By default, the data that is passed to the plug-in is the series that is used as the basis for the light curve mean plot. The results may then be plotted and/or stored in a table. Support is provided for creating a dialog for displaying the results of the period analysis and for selecting a period value with which to create a new phase plot.
Available Plug-ins
For a list of currently availalble VStar plug-ins and documentation for each, see the GitHub VStar wiki.
Additional Resources
- To download VStar or its User Manual, visit the VStar Overview page.
- View the source code for the plug-ins created by volunteers.
- Discuss techniques and results of data analysis on the Data Analysis Forum.
- For general help with VStar, please post your questions or comments on the VStar Forum.


