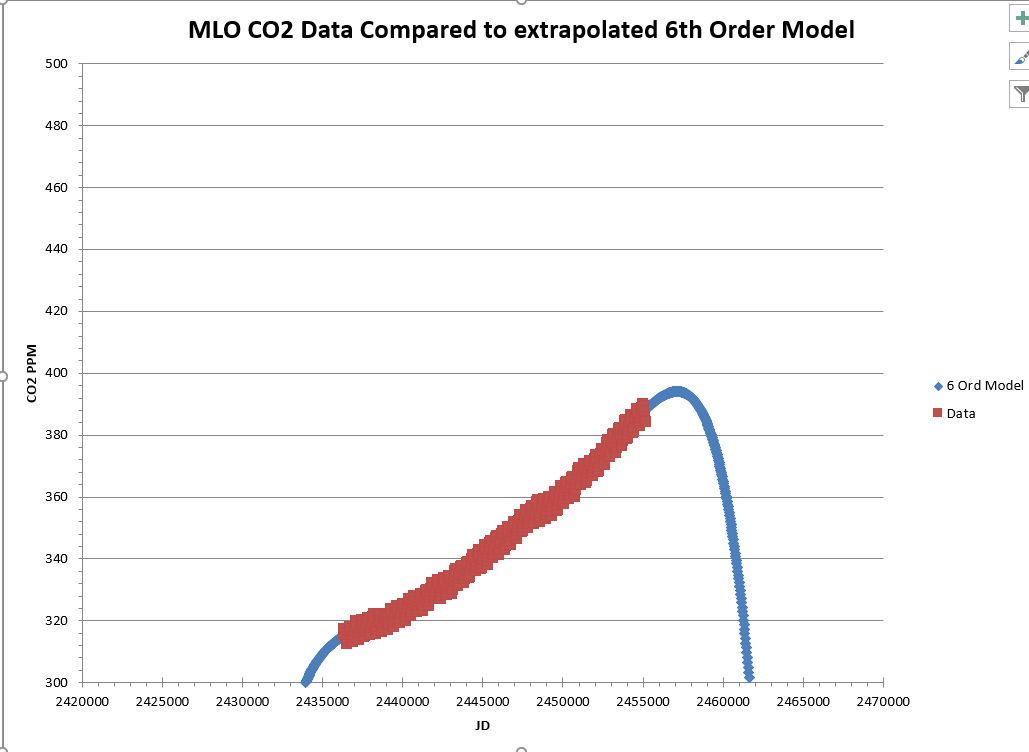
When fitting polynomials to light curves you generally avoid over-fitted polynomials that exhibit "wiggles" near the ends of the data set that are not supported by the trend of the data. However, currently in VStar, we have no way of avoiding polynomials that "fly-off" in unrealistically before the data set begins or after it ends. here is an example from the Analyzing Data with VStar course. The 6th order polynomial is the best fit to the data according to the AIC and BIC criteria for polynomial orders 1 through 10. If you plot the data with an extrapolation of the 6th order model beyond the ends of the data, you see the following.

By the way this is data of monthly atmospheric CO2 measurements. I think it would be helpful to have a plug-in that would plot the data and the model over a time period having a user selectable extension beyond the ends of the data. Having such a view
PS: I originally uploaded the wrong order fit. This is the correct one but it is still completely unrealistic.


Hi Brad
When you say the following:
do you have in mind the ability to create a model that is essentially a piecewise function defined so that times before and after the end of a "sane" fit time range such as you show for the Mauna Loa CO2 data above can be treated independently?
David