

Charts and Photometry Tables for T CrB
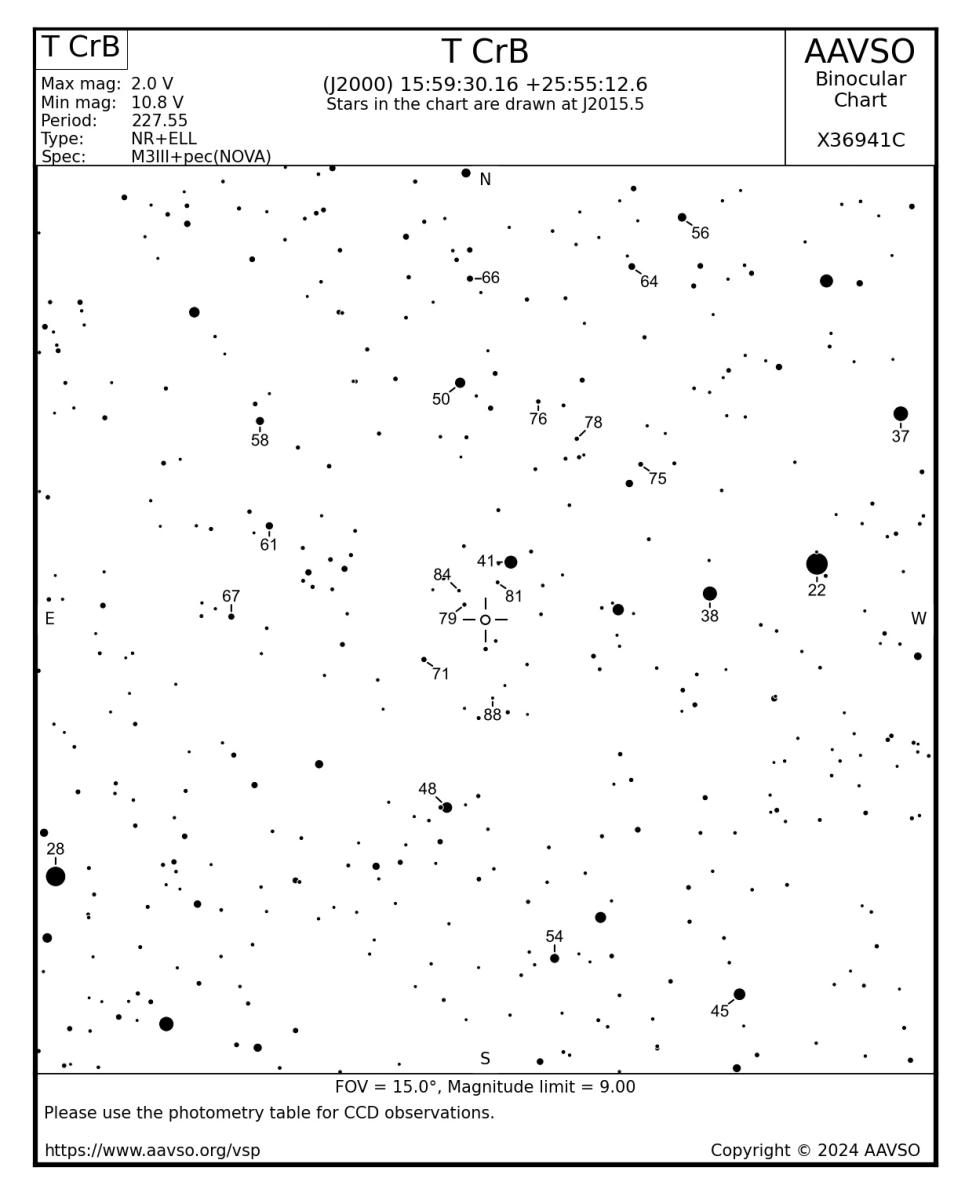
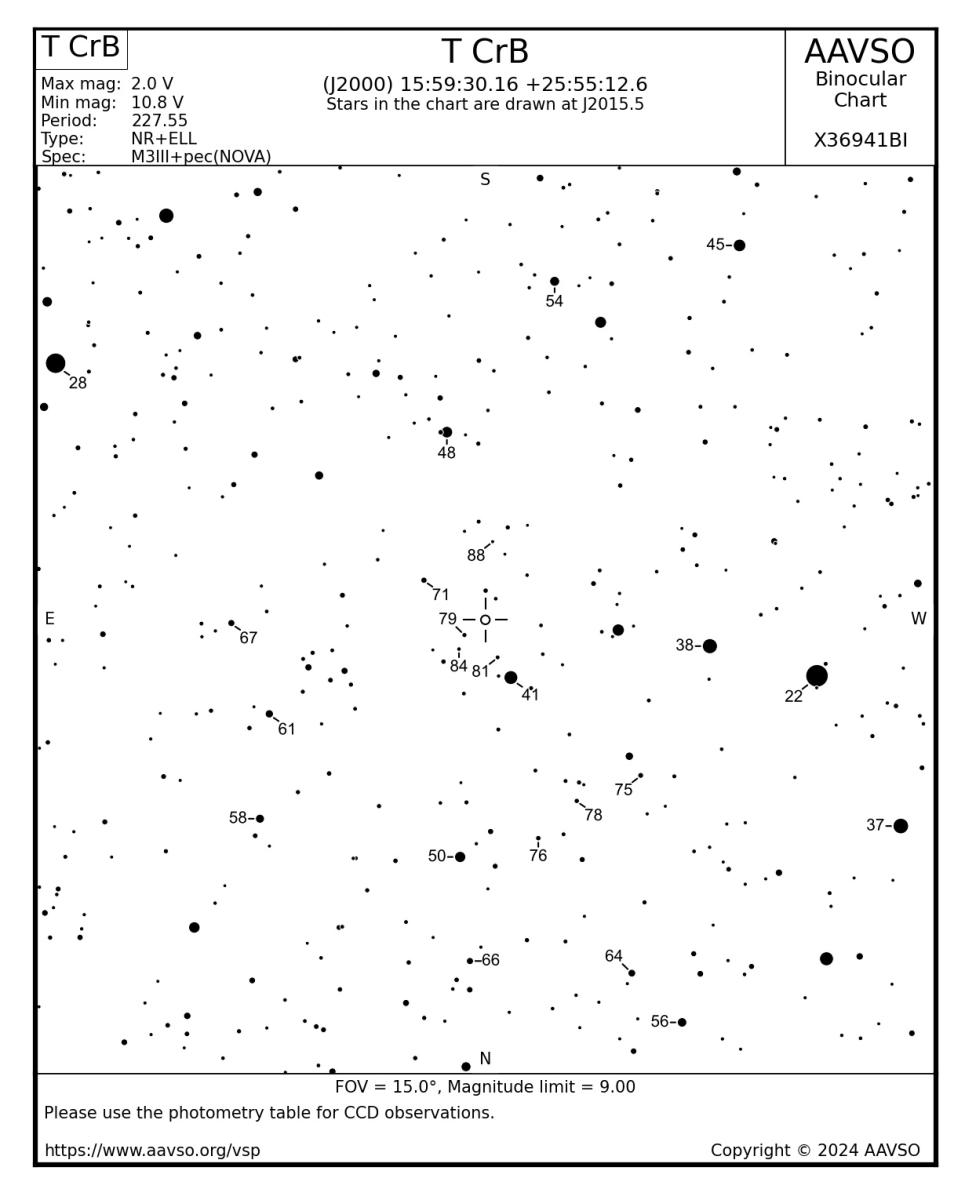
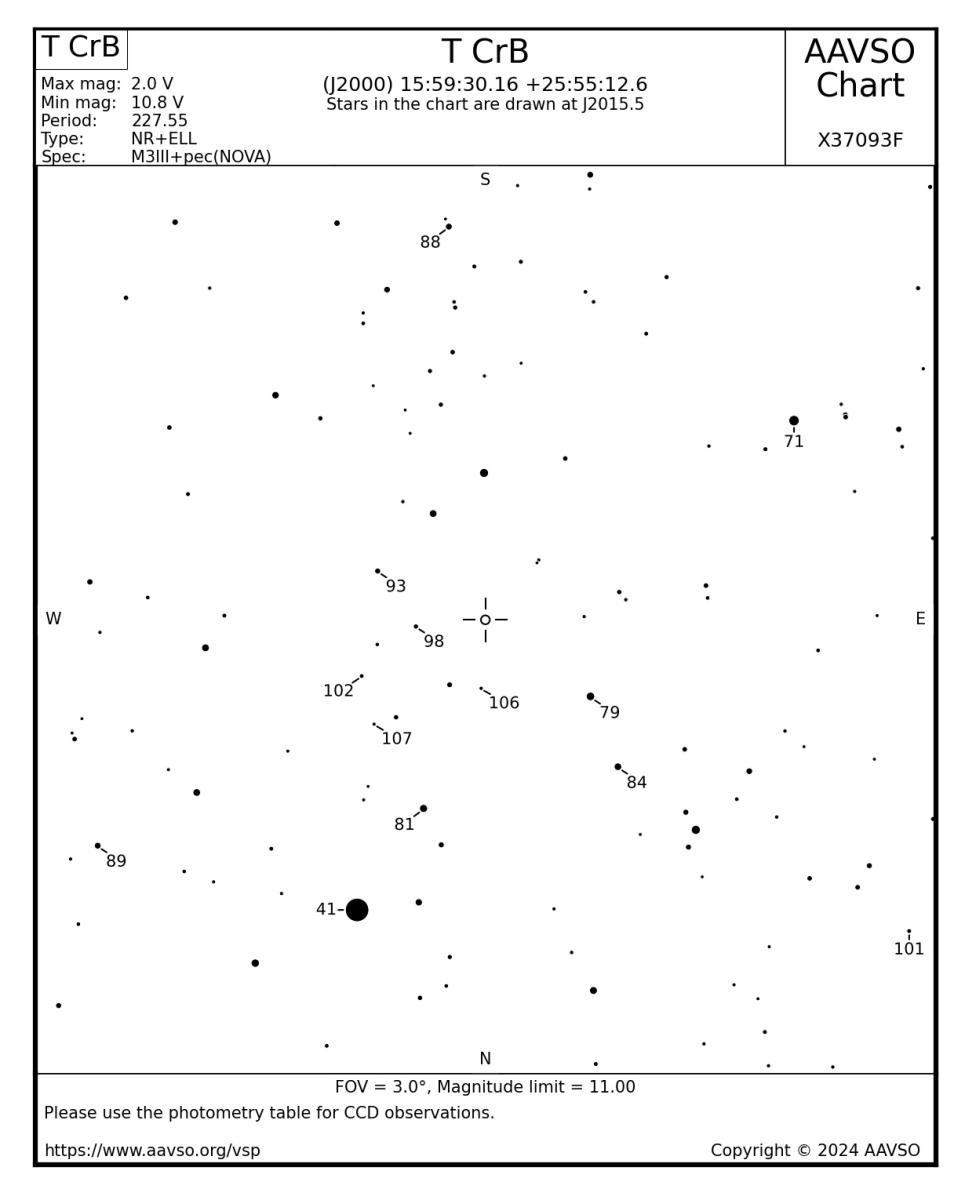
Finding charts with comparison stars and related multicolor photometry tables for different scales of T CrB have been created for your convenience. The comparison star magnitudes reflect the revision of 02 July 2024 AND the July 16 re-introduction of the 102 comparison star on the B and D charts.
| Scale of chart (.jpg) | Scale of chart (.pdf) | FOV deg | FOV arcmin | Limiting V mag | Photometry table |
| A (binocular) North up | A (binocular) North up | 15.0 | 900 | 9.0 | table |
| A (binocular) South up | A (binocular) South up | 15.0 | 900 | 9.0 | table |
| B (North up) | B (North up) | 3.0 | 180 | 11.0 | table |
| B (South up) | B (South up) | 3.0 | 180 | 11.0 | table |
| D (North up) | D (North up) | 1.0 | 60 | 14.5 | table |
| D (South up) | D (South up) | 1.0 | 60 | 14.5 | table |
Customized charts may be created using the AAVSO Variable Star Plotter (VSP). Photometry bands to include in the photometry table are shown at the bottom of the VSP form; check the boxes of the bands you want to include (Sloan photometry as well as Johnson/Cousins available).
Additional AAVSO material on T CrB
Please read/watch these resources to learn more about the science and history of T CrB and how you can be part of this once-in-a-lifetime event!
• Announcing T CrB pre-eruption dip: https://www.aavso.org/news/t-crb-pre-eruption-dip
• T CrB webinar YouTube video: https://www.youtube.com/watch?v=1Zfg67Q-szU
• AAVSO Alert Notice 750: https://www.aavso.org/aavso-alert-notice-750-backup-copy
T CrB Coordinates (2000.0): R.A. 15 59 30.16 Dec. +25 55 12.6 (from VSX entry for T CrB)