

T Canum Venaticorum (T CVn)
By Rich Roberts
As a member of Generation X in the United States, the mall was the place to be when I was young. But not just any mall would do, you needed to be at the “cool” mall. “Cool” malls typically had an anchor store, a store so compelling that you were willing to go out of your way to go there. Other stores wanted to be located at this “cool” mall because they could ride the coat-tails of the compelling anchor store. If you think of Canes Venatici as if it were a mall, it has two anchor stores, V CVn (https://www.aavso.org/lpv-month-April-2020-V-CVn) and M51. These are compelling objects either for their scientific relevance (V CVn) or sheer beauty (M51). Either way, these are objects you’re willing to drag the scope out and star hop for. But since you’re already at this “mall,” you might as well check out the other “stores” nearby, even if they are not quite as spectacular as the cool anchor store. You might not be willing to go out of your way just for T CVn, but hey, you’re already in the neighborhood. So stop by and check it out because T CVn has some interesting things going on as well.
T CVn is a member of the LPV program. The LPV program was established to give LPV observers a list of stars to prioritize. Program stars were selected due to a historically high observing cadence, a decently defined visual light curve which spans decades, and scientific relevance. Four LPV program stars call Canes Venatici home: R CVn, T Cvn, V CVn, and TU CVn. Of the four, V CVn is the most observed, which is not unexpected since the star is so fascinating. Over the past five years, about 60 visual observers log around 300 total observations of this star per year. R CVn and TU CVn each receive about half the number of observers and visual observations of V CVn. T CVn receives the least amount of love, garnering only 30% the attention of V CVn in terms of unique observers and total observations. This should not be the case! T CVn is arguably the second most interesting star of the bunch and has a magnitude range similar to R CVn. T CVn should be getting similar attention (if not more) to these other stars, and I hope this article gets T CVn the love and attention it deserves. I modified the chart I made in the V CVn article referenced above to point out T CVn, as well as the other two program stars in the constellation.
(A spreadsheet of the LPV program stars can be found here: https://www.aavso.org/lpv-section-file-downloads. You can also filter search results in VSX using the “campaign or program” combo box and selecting “LPV program.”)

So what makes T CVn interesting? T CVn is on a list of pulsating red variables exhibiting changes in their behavior and in need of more visual observations, which is published by Dr. John Percy (The Percy List is found here: https://www.aavso.org/sites/default/files/images/The%20Percy%20List_1.pdf). Dr. Percy notes the amplitude of T CVn seems to be decreasing. Let’s look at the light curve and see what it can tell us.
As of this writing, 12,281 total observations of this star are logged in the AID. The first observation was made in June of 1904 by Leon Campbell—former AAVSO President (1919–1922) and Recorder (1925–1949) (title changed to Director after 1956). 93% of the observations are visual. The observing cadence was high between the 1930s and late 1990s, but has waned in recent years. This needs to change, because visual inspection of all the visual and Johnson V data in the AID (below) shows something is definitely going on.
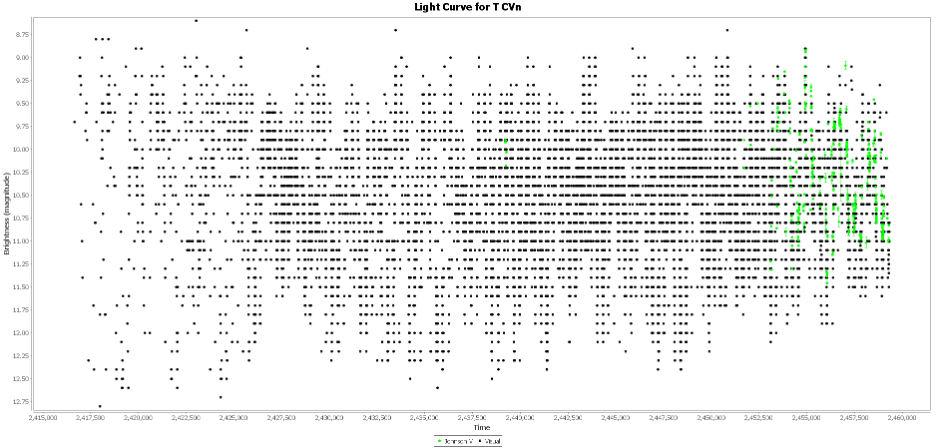
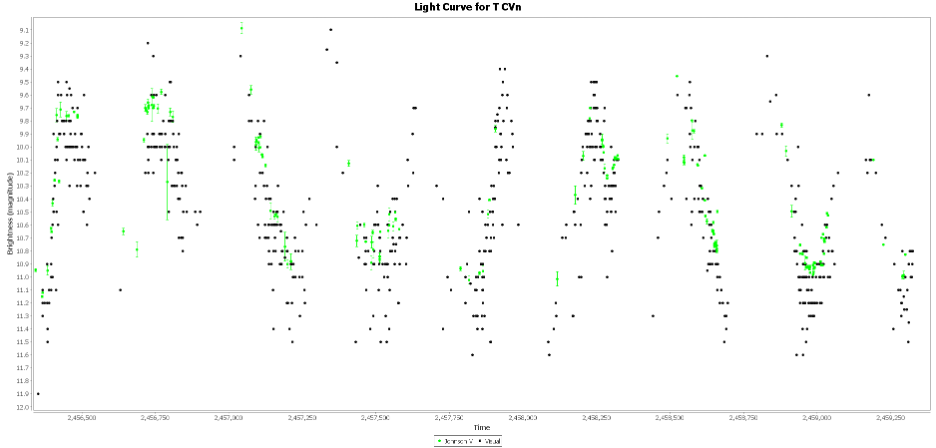
Although T CVn appears to reach a fairly consistent maximum, the minimums appear to be getting brighter. This trend appears to start around JD 2,457,500 and is still ongoing. If we focus in on the last ten cycles, you can see the star has been achieving visual maximums around 9.5, and visual minimums around 11.6.
So, is this much different than the past? Let’s look at what the star was doing in the 1980s and then the 1950s.


In both of these time frames, T CVn is reaching maximums close to nine and minimums around 12.5. So based on this visual inspection of the light curve, we can see in the last eight years, the star does have a smaller amplitude than in the past. The maximum has dimmed by about half to a quarter magnitude, and the minimum has brightened by almost a full magnitude. But was the behavior we witnessed in the 1950s and 1980s consistent with the entire history of the star? If you go back and look at the entirety of the light curve, there appears to be bright minima occurring around JD 2,427,500. So, let’s take a closer look at what this star was doing in the 1930s.

As you can see from this light curve, around JD 2,427,500 the star was reaching maxima around 9.5 and minima around 11.5, which is similar to what it is doing now. After several cycles of this, the amplitude started to increase again. So, is this amplitude contraction something cyclical with the star that varies over time? Will the amplitude reverse course, steady out, or continue to shrink? We need to keep observing to find out.
We don’t need to rely solely on visual inspection of the light curve to figure this out. VStar has cool features allowing us to plot out the semi-amplitude over time.

The amplitude low we saw in the 1930s is evident, and then the amplitude rebounded quickly. After another decrease the average amplitude was relatively steady for several decades, which we saw in the 1950s and 1980s light curve, until decreasing again recently. We need to continue monitoring this behavior.
So, the amplitude is changing, but what about the period? VSX lists a 290-day period and classifies the stars as SRa. This 290 period is widely cited in literature, although some classify it as a Mira, and some others as an SRa. This is an interesting distinction since both Mira variables and SRa variables are defined by highly regular periodicity. Miras are further defined to have amplitudes of 2.5 or greater. As we have seen, sometimes T CVn’s period is greater than 2.5 and other times (like right now) it is not. Using VStar, I found the strongest power in the Fourier spectrum for periods of 290 and 293 days.

This 290-day period provided a decent enough phase plot for me to be happy.

But what about those spikes in the spectrum at 161.7 and 162.8 days? Are those alias frequencies or are they real and this star is multi-periodic? I did not find any studies where this star was specifically looked at for multi-periodicity. One thing that stood out to me was the ratio of the main period (P1) and this shorter period (P2). Mattei et al. (1997) looked for multi-periodicity using AAVSO data for a multitude of pulsating red giants. T CVn was not on their list of bi-periodic stars, but one thing noted in the paper was that when the ratio of P1/P2 for an SR star was between 1.7 and 1.95, the second period was usually real; when outside this range, usually an alias. The ratio of these two frequencies is 1.8, so in the range, Mattei et al. (1997) found the second period to usually be real. Multi-periodicity is much more common amongst SRb-classified stars, but some SRas and Miras do exhibit this behavior as well. Hopefully someone more qualified than me will take a closer look to determine the validity of this second period.
Using VStar, we can also look to see if the period is changing with time.
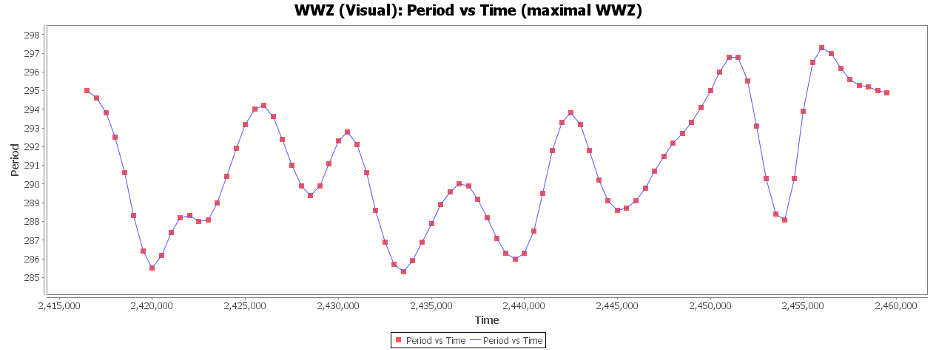
The mean period appears relatively steady. The period “meanders” over time between 295 days and 285 days, but this behavior is fairly typical for this class of star. There may be some period change occurring, however. Templeton et al. (2005) studied a large sample of Mira stars looking for period changes. They found that T CVn was one of 57 Mira stars with dLn(P/dt) greater than two standard deviations above the measurement error. So, there is evidence of statistically significant period change, although T CVn barely made the list and is not undergoing any type of extreme period change, like T UMi or LX Cyg. Still, this is something we should continue to look out for.
So please stop by and observe this star. If you’re already observing V CVn, you have no excuse! You’re already at the “cool” mall; go ahead and stop by one of the other storefronts while there. You’ll be able to add a high-value star to your program with only an extra few minutes of observing time. T CVn is pretty easy to find since it is nestled between two bright 7th magnitude stars. A lot of questions surround this star and the only way to answer them is through continued visual observations.
References:
Mattei, J., Foster, G., Hurwitz, L., Malatesta, K., Wilson, L.A., & Mennessier, M. (1997) ESASP.402..269M
Templeton, M., Mattei, J., & Wilson, L.A. (2005) Secular Evolution in Mira Pulsations. The Astronomical Journal,
130:776 –788.