

V Bootis
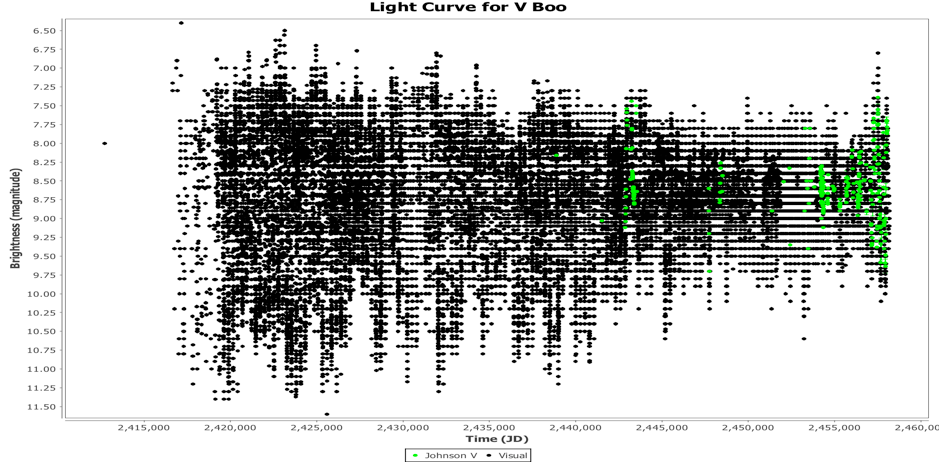
V Boo is an interesting semiregular star that has been observed by AAVSO observers and members since 1904 (a single observation is recorded in 1893). Over 75,000 observations are in the AID from over 2,000 different observers as can be seen in the light curve shown below which displays all observations in the AID. It is one of the Legacy LPV Program stars.
It's spectral class is M6e according to the VSX and is classified as an SRA. Semiregular stars classified as SRA have amplitudes less than 2.5 magnitudes and show persistent periodicity. The GCVS lists V Boo as having a visual magnitude range of 7 to 12 with a mean period of 257 days whereas the VSX lists the mean period as 258.01 days.
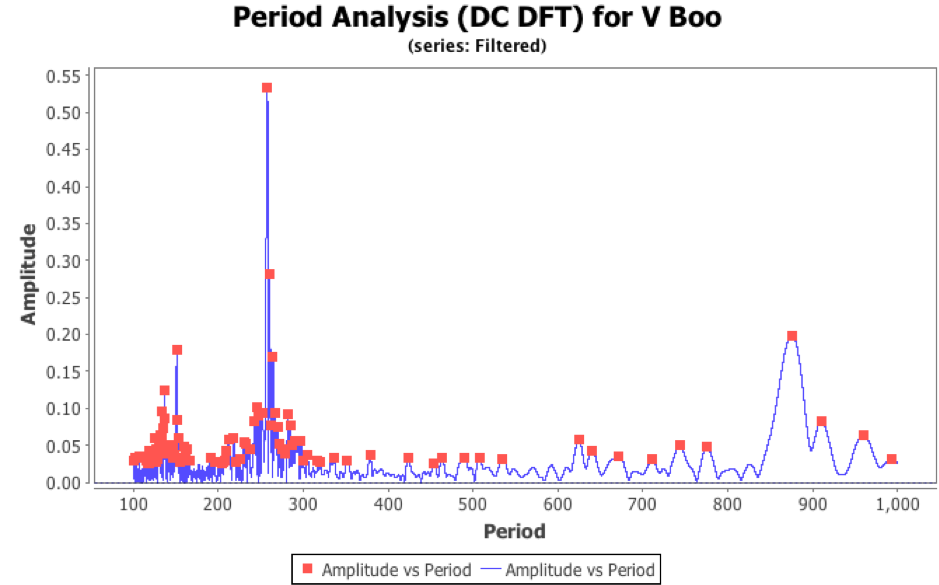
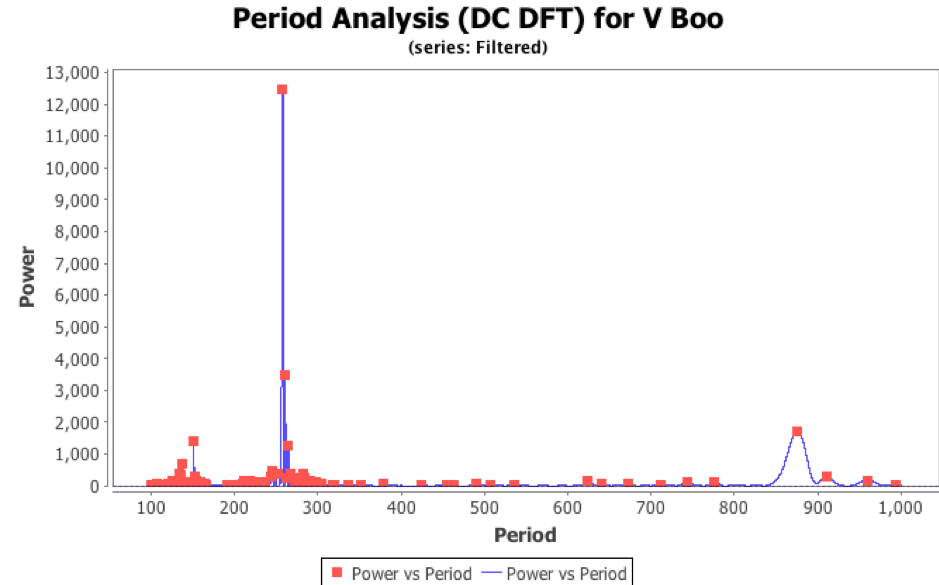
A DC DFT analysis of all observations in the AID shows a mean period of 257.76 days (annual aliases at 875.9 and 151.1 days are clearly evident). There is also a secondary period present at 136.9 days. The dual period nature of V Boo was presented in Pejcha et al (2001) and in earlier studies. Pejcha et al (2001) determined the value for the two periods as 257.8 days and 137.1 days which is very close to the current analysis which contains an additional 20 or so years of data. The period analysis is shown in the Figures below.
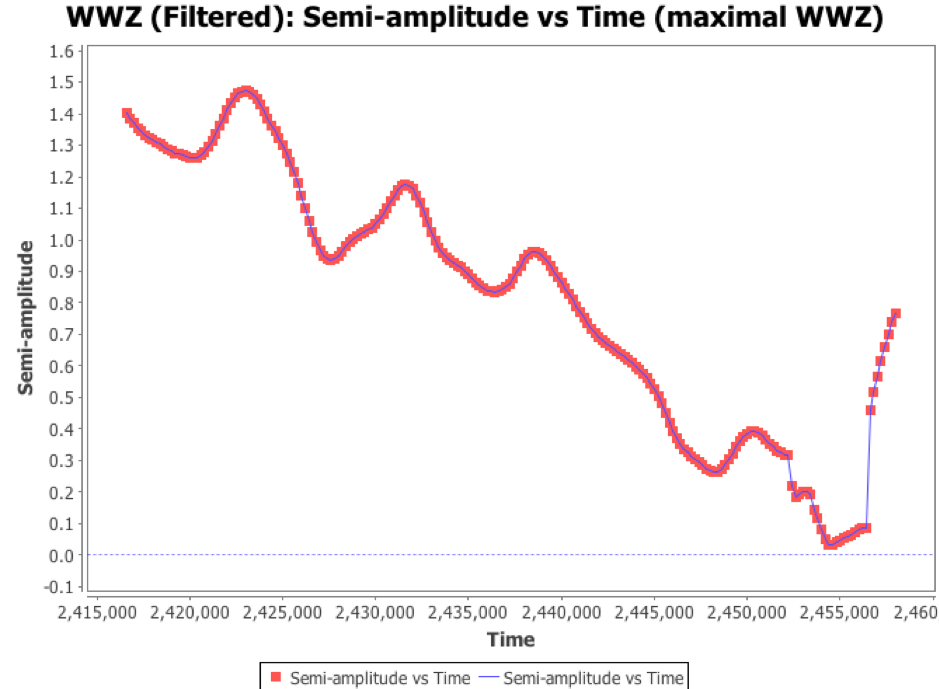
A WWZ analysis has shown that the mean period has been relatively stable remaining between a range of 255 to 262 days with a slow meandering behaviour which is quite common for many long period variables.
As can be seen from the overall light curve above, the most interesting feature displayed by V Boo is it’s apparent decrease in amplitude which has occurred at a relatively slow and gradual pace over it’s observational history. This has also been noted in many previous studies. The amplitude has decreased from approximately 4.5 magnitudes down to 2.5 magnitudes at the present day. The semi-amplitude with time is graphed in the Figure below.
A number of researchers have proposed reasons for this decrease in amplitude. Pejcha et al (2001) attempted to explain the amplitude decrease based on beating between two close periods. Their DFT analysis identified a further peak in the signal very close to the main period of 257.8 days. This peak coincides with a period of 259.2 days. In the current analysis performed for all data in the AID, this close peak is also present which corresponds to a period of 260.6 days, thus quite close to the additional peak identified by Pejcha. The current analysis also shows another peak with a slightly weaker signal at 264.6 days. Pejcha suggests V Boo’s period is stable most of the time but sometimes changes to a slightly longer value. They further note that the decrease in amplitude is observed only at the main mean period of 257.8 days and not at the secondary period around 137 days. They surmise that the presence of two close periods will result in an apparent amplitude modulation with the amplitude rising and falling periodically. Their conclusion was that the amplitude decrease is due to an interference between the periods at 257.8 and 259.2 days which does not affect the secondary 137 day period. They also state that other stars have been observed with an amplitude modulation that can be explained as being due to beating between two close periods, but they note that no other star has periods that are as close together as for V Boo.
Greaves et al (2000) analysed BAA visual data and also derived periods of 257.8 and 137.1 days as per Pejcha (2001).
Kiss et al (1999) attempted to explain this amplitude decrease due to the evolution from a Mira state to a semiregular state. Kiss confirmed the presence of a longer and shorter period (257 and 137 days). They did note that the changes to the lightcurve that have occurred only hint at the probable change of variability type and that further spectroscopic or near infrared photometric observations would be desirable. They also state that the most important requirement for precise frequency determination is to have as long a time series as possible which highlights the value of continued visual and CCD observations of stars such as V Boo.
Szatmary et al (1996) performed a light curve analysis of V Boo that agreed with Pejcha’s analysis showing the amplitude of the longer period was the one that strongly decreased whereas the amplitude of the shorter period remained essentially constant. However Szatmary disagrees with the theory regarding the beating of two close periods that can produce periodic amplitude modulation due to the long time scale of the amplitude decrease. They tend to support the view of some inherent evolution that the star is undergoing which is causing the amplitude decrease.
So there does not appear to be a clear cut reason for the decrease, or at least there appears to be some disagreement. All authors make a point that further photometric observations are crucial to increase our understanding.
V Boo is an interesting semiregular to follow so all are encouraged to maintain the coverage.
References
"Application of wavelet analysis in variable star research. II. The semiregular star V Bootis.", K.Szatmary et al, Astronomy and Astrophysics, v.308, p.791-798, April 1996
“The amplitude decrease of V Bootis”, O. Pejcha et al, JAAVSO, Volume 29 No. 2, 2001
“V Boötis, a semiregular variable of declining amplitude”, J.Greaves, et al, Journal of the BAA, Volume 110, April 2000
“Multiperiodicity in semiregular variables”, L.L Kiss et al, Astronomy & Astrophysics, April 1999