JANUARY 2017
RS CYGNI
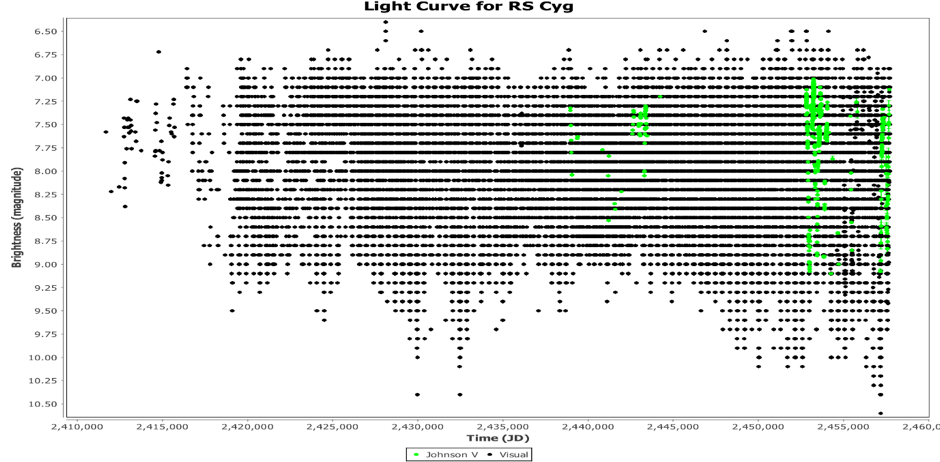
RS Cyg is a bright semi regular star that has been well observed by the AAVSO since 1890. Over 42,000 observations are in the AID from over 1,300 different observers as can be seen in the light curve shown below which displays all observations in the AID. It is one of the Legacy LPV Program stars.

The light curve based on the last 2,000 days is shown below.

The light curve based on the last 700 days is shown below.

It's spectral class is C8.2e according to the VSX and is classified as an SRa. The GCVS lists RS Cyg as having a visual magnitude range of 6.5 to 9.5 with a period of 417.4 days. Analysis of all AID data in the period 1890 to the present day indicates a mean period of 419.0 days. This places RS Cyg in a large group of Miras and semi regulars with a long period (>350 days) which do generally show some interesting light curve characteristics.
SRa stars are pulsating variables in which temperature, ionization, and opacity oscillate to produce variable periods, amplitudes, and/or multiple periods. These processes happen in the stars’ convective layers, and it is possible that convection plays an important role in their behaviour. In several SRa stars chaotic behaviour has been detected. This includes RS Cyg. Buchler et al (2004) and Binder et al (2008) specifically perform analysis of RS Cyg. Firstly they were able to eliminate multiperiodicity for these pulsations for RS Cyg (i.e., they are not caused by the excitation of a small number of pulsation modes with constant amplitudes). They believe it is low dimensional chaos which explains the irregularity in the light curve. They performed nonlinear analysis of the time series for RS Cyg and were able to postpredict the behaviour of RS Cyg to within 10% of the maximum variation in brightness in the light curve over a time horizon of approximately 16 months and further predict the future light curve for the next 16 months.
Only limited CCD photometry has been reported to the AID, however a couple of V and B measures indicate that it is a very red star (B-V = 4.0 at minimum). This may explain the generally wide scatter in the visual estimates in combination with the bright range of the star.
RS Cyg is contained in the list of LPV Humps maintained by Frank Schorr. It shows a hump (or possibly a dual maxima feature) in the ascending branch of the light curve. It’s difficult to see this in the phase diagram below based on the visual observations due to the relatively large scatter, however its more clear if you focus on the V measures.

Marsakova and Andronov (2007) analysed a selected group of LPV's which show hump features in their light curves based on 80 year's worth of data from the VSOLJ and AFOEV and RS Cyg was one of the stars analysed in greater detail. They found that, as with many other LPV's with humps, the humps don’t occur in every cycle. For RS Cyg, they found that it occurred on average about every second cycle (56 cycles in 100 to be more precise). They do note that the C stars they analysed (which includes RS Cyg) display noisiness in the light curve and other irregularities which does make it difficult to distinguish subtle hump or double maximum features that may be present.
They also found that the average duration of the hump was 51 days which represents about 12.2% of the total period. The average phase of the cycle where the hump appeared was 0.20. The phase diagram based on AAVSO observations seems to indicate the phase is about 0.30 where the hump is observed. RS Cyg has an asymmetrical light curve with the ratio of duration of ascending branch to the total period being about 0.60.
Marsakova and Andronov found a reasonably strong correlation between the brightness at which the hump generally occurs in a given cycle and the brightness of the preceding minimum and the following maximum. For RS Cyg, these correlations were quite strong. However their paper did not propose any physical significance of these correlations in terms of what may be causing the hump behaviour.
An analysis has been performed to ascertain any period changes in RS Cyg over the past 125 years based on observations in the AAVSO AID. The figure below suggests that there has been a "meandering" of the period between the range of 407 to 427 days. This slow meandering behaviour (with period changes general less than 5% of the mean period) is relatively common in the longer period Miras and semi-regular stars.

RS Cyg is an interesting LPV to follow so all are encouraged to maintain the coverage that has been in place over the last 125 years.
References
"Variability of Long Period Variable Stars III: Changes in the Parameters of Humps in the Ascending Branch", V.I Marsakova & I.L Andronov, Astrophysics, Vol 50, No. 1, 2007
“Dynamics and forecasting of two chaotic stars”, P-M. Binder, et al, Astrophys. J., 685, L145-L148 (2008)
“Evidence for low-dimensional chaos in semiregular variable stars”, J.R Buchler, et al, Astrophys. J., 613, 532-547 (2004)

