

Hi, I am new to the AAVSO and new to doing aperture photometry. I would be grateful for some help.
I obtained two images (b,v) of M67 via the Las Cumbres Telescope network (0.4metre) , both were taken a few minutes apart on the same date and from the same telescope in tenerife. I performed aperture photometry on a selection of 22 stars using the Makalii software and obtained standard data from the AAVSO standard star list. I checked the instrumental v and b values for linearity by plotting them against the standard V and B values and obtained good linearity (R2=0.999 and 0.998). I then plotted the colour transform (b-v vs B-V) and also obtained a good linear fit (R2=0.982). However when I came to plot the v mag transform (V-v vs V-B) and b mag transform (B-b vs B-V) I obtained a very rough looking plot with appalling R2 values (R2= 0.0075; R2=0.00023). I am not at all sure why this is and what I should do next to sort it out, I have uploaded a file of the data.
Thanks
Mark
My experience matches yours: my color transforms always look much better than my magnitude transforms. I suspect this is true for most amateur systems.
The methodology recommended by the AAVSO is to use the magnitude coefficients. But there are other choices. The "Alternate" methodology offered in the VPhot TransformApplier uses the color transforms along with just one magnitude coefficient.
That there are other choices underscores that transformation is not a perfect process, that there is not one perfect answer. Each coefficient represents a true description of your system (camera and optics) relative to the "standard". When you are dealing with two filters there will be three coefficients available (eg Tbv, Tb_bv, Tv_bv). You can only pick two coefficients/equations to solve for the two variables in question. My rationale for the Alternate method is to pick the best coefficients judged by their measured error.
How to improve the quality of the magnitude coefficient? Good question. Need wider range of color I suspect.
George
Mark,
The magnitude transforms you derived from the ugly looking plots are probably just fine. The problems you see result from the spreadsheets default range settings for the Y axis. Reset the Y axis to a much larger range. Of course this won't change the slope, but it will make you feel a lot better about the results.
Don't pay too much attention to the R squared values for the magnitude transform plots. I think a better way to estimate the uncertainty in these numbers, and also to get more accurate values for your transforms, would be to calculate the averages of three independent sets of transforms and use the s.d. as the error estimate. ...or maybe it should be the s.d. of the mean. Statisticians please advise.
Phil
Phil et al:
If you search "R squared of a zero slope line" you will discover that the R squared value should be close to zero NOT one, when you have a nearly perfect fit for a zero slope.
Ken
Thanks, Ken.
There it is Mark. This is why your appalling R squared numbers are consistent with good magnitude transforms. However, I wouldn't rely on this to evaluate your transforms. Better I think to make three measurements of each transform (color, Vmag, Bmag), average the results, and use the s.d. for error estimates.
Phil
Mark et al:
In fact, although you can expect to get quite close to R^2=1 for the color coeffs, you will drive yourself crazy trying to achieve R^2=0 for your magnitude coeffs. Remember that your coeffs will likely only be within 10% of ideal (0 or 1). In the case of the magnitude coeff (~0), the slope of the coeff will not be so close to zero that you can expect the R^2=0. It will be much larger/poorer for most available filters, perhaps 0.2. Your R^2 is suprisingly small. I am impressed!
You should take repeated images of the standard fields and calculate the coeffs for your filters. You will discover how "good" (or not) your measurements are over time and sky conditions. Make sure that you use as wide a stellar color range as possible. The points at the "ends" of the fit lines (color extremes) have a lot of impact on the slope! Don't reject fainter comps automatically. Redder stars are often somewhat fainter red dwarfs.
I really like TG because you can easily see which comps yield poor agreement (outliers) without having to be too selective of magnitude, SNR, and overlap. TG will also allow you to easily monitor changes with time, select those measurements that are "good" (smaller error) and generate optimum averages. I generally use up to 100 M67 comps in my TG calculations. I select comps with SNR>20. It is simple and visually intuitive!
Ken
I believe part of the confusion here is that we are using the r squared as a judgement for the goodness of the coefficient. I know I have.
To construct a confidence interval for the slope of the regression line, we need to know the standard error of the sampling distribution of the slope.
That would be SE = sqrt [ Σ(yi - ŷi)2 / (n - 2) ] / sqrt [ Σ(xi - x)2 ]
We should look into having TG generate this statistic.
George
Thanks very much for all your replies, it has put my mind at rest, I was clearly misinterpreting the R2 values for the vmag & bmag transforms. I will continue to accrue more datasets for M67 so that I can improve on the results over time.
Thanks once again,
Mark
Phil wrote: "The magnitude transforms you derived from the ugly looking plots are probably just fine. The problems you see result from the spreadsheets default range settings for the Y axis. Reset the Y axis to a much larger range. Of course this won't change the slope, but it will make you feel a lot better about the results."
It's possible that may be the case, but I think that it may be worthwhile re-working the process. I say this because my transform plots (not from M67) are much tighter than Marks with Y axis scales roughly similar to his.
See attached. I hope the image upload process works - it's the first time I've tried it on the new web site.
Roy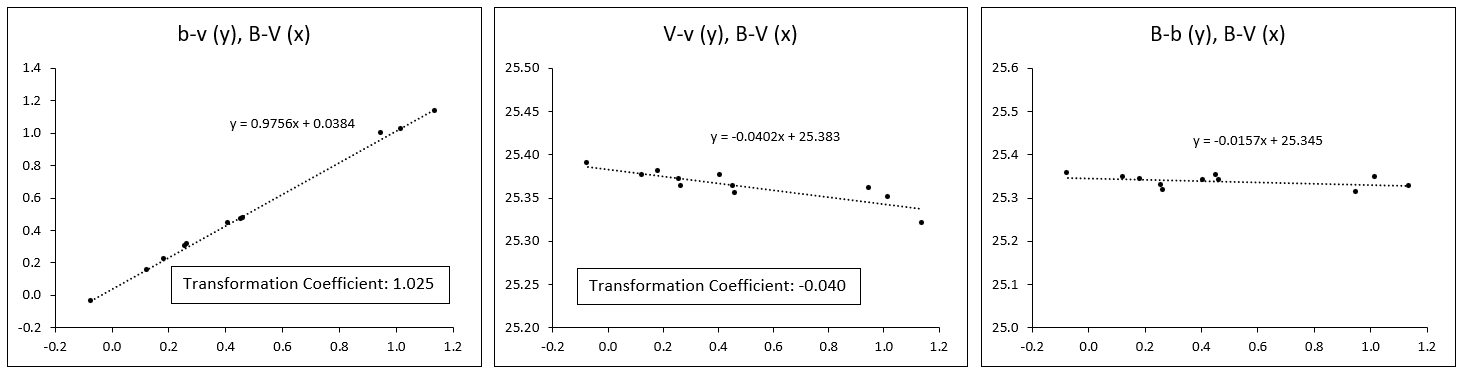
Hi Roy,
Impressive data. I am interested in what object you obtained your data on and what the R2 values were?
Thanks
Mark
Hi Mark,
I use standard stars from the E Regions (Menzies, J.W. et. al. 1989, S. Afr. Astron. Obs. Circ.. 13, 1) for my transforms. These are suitable only for southern observers, having a DEC of about -44 degrees. For the plots posted, the targets were 8th and 9th mag stars in V, imaged with a ZWO ASI1600MM camera with V and B filters through a 120mm f/7.5 refractor.
The r squared values for the three plots posted (from left to right) are 0.998, 0.734, 0.192 respectively. I don't pay any attention to these. The closer the plot is to a straight horizontal line the smaller the r value. The residuals are more important, and I like to see a more or less symmetrical distribution of the residuals along the plot. Another reason I suggested reworking your process is that the distributions of your data points along the plots (for the transforms you were worried about) are highly asymmetrical.
Roy
Thanks for the feedback.
Regards,
Mark