

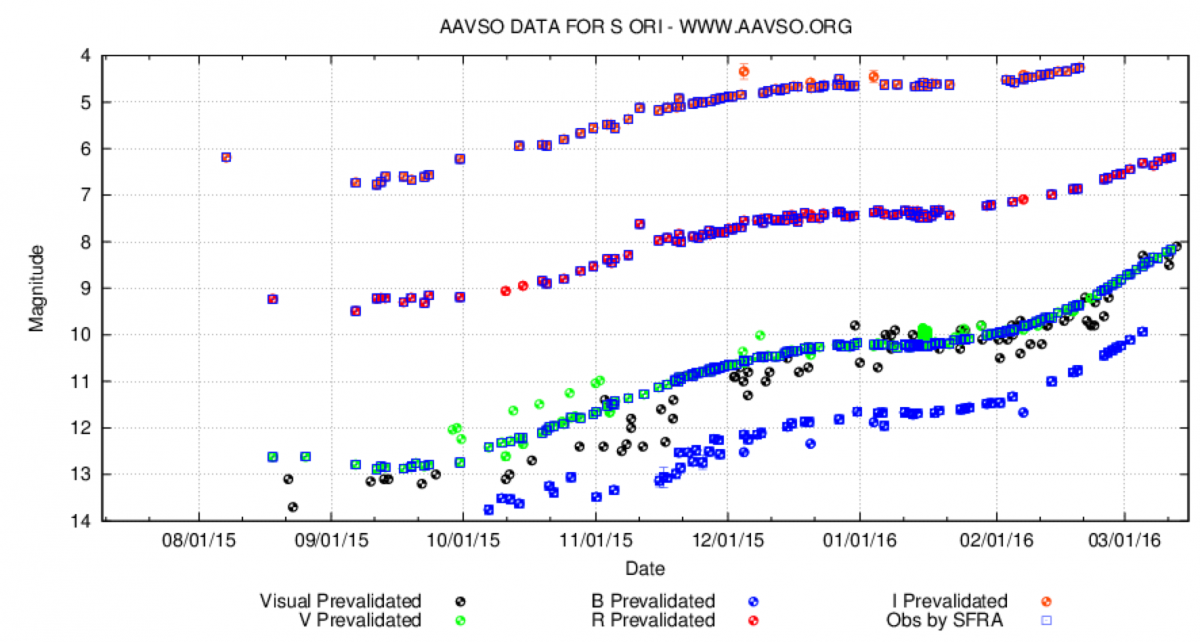
Light curve for the previous 1000 days from the AAVSO DB. (5/4/2011)
| cycle | Start of Hump (JD) | Mag in V at start of hump | Days between "hump" starts | End of "hump" (JD) |
Mag in V at end of hump | Length of hump |
Date of maxima at start of this cycle | Mag in V at Maxima | Days between Maxima | Days from Maxima to start of "hump" | Days from Maxima to end of "hump" |
comments |
| Cycle 126 |
||||||||||||
| Cycle 125 |
2456953 +-3d |
10.63 | 2456985 | 10.43 | @32 +-3d |
@2456634 | 7.4 | @415* | @319 +-3d |
@351 | ||
| Cycle 124 |
@2456219 | @415* | ||||||||||
| Cycle 123 |
@2455804 | @435* | ||||||||||
| cycle 122 |
2455656 +-1d |
@11.21 | @434 | @2455369 | @430 | @287 | 66.7% slow hump | |||||
| cycle 121 | 2455222 +-7d |
@416 | >2455305 | >78 days |
@2454939 | @423 | @ 283 | 66.9% | ||||
| cycle 120 | 2454806 +-2d |
@10.92 | @2454850* +-15 d |
@11.28 +-.5 |
@58.5 days | 2454506 +-10d |
439* | 290 | @344 +-10d |
66% double hump | ||
| cycle 119 | <2454366 | @2454443* +-5d |
>78 | 2454077 | 440* | @366 +-5d |
||||||
| cycle 118 | @2454014* | @10.02 | 2453637 | 419* | @377 | unknown | ||||||
| cycle 117 | 2453218 | 425 | unknown | |||||||||
| cycle 116 | 2453085 | 10.667 | 2452760 | 325 | asas-1 | |||||||
| cycle 115 | @2452642 | @407 | @2452698* | @56 | 2452338 | 444* | @304 | @360 | 68.4% flatish | |||
| cycle 114 | @2452235 | 10.75 | @2452280* | @10.5 | @45 | 2451894 | 416* | @341 | @386 | 81% | ||
| cycle 113 | 2451478 | |||||||||||
| cycle 112 | ||||||||||||
| 111 | ||||||||||||
| 110 | @2450462 | @416 | >2450549 | @245019x | ||||||||
| 109 | @2450046 | 2450140 | @94 | |||||||||
| 108 |